

AIRPLANE AVAILABILITY AND TURN-TIMES
Airplane availability is the total number of days in a given period, less downtime required for airplane maintenance. Maintenance check intervals and check contents are key drivers for overall maintenance program efficiency, which in turn impacts airplane availability. Airplane systems and components reliability further influence the downtime required for additional maintenance. Airplane aging also leads to increased maintenance requirements and lower airplane availability.
For planning purposes, it is useful to convert airplane availability from number of days to number of trips. In order to simplify the analysis, assume that the airplane performs all trips at a specific trip distance. Based on airplane performance characteristics, average block time (defined as time from airplane pushback from the gate at origin to arrival at the gate at destination) for the trip can be estimated, using typical mission profile and speed schedule.
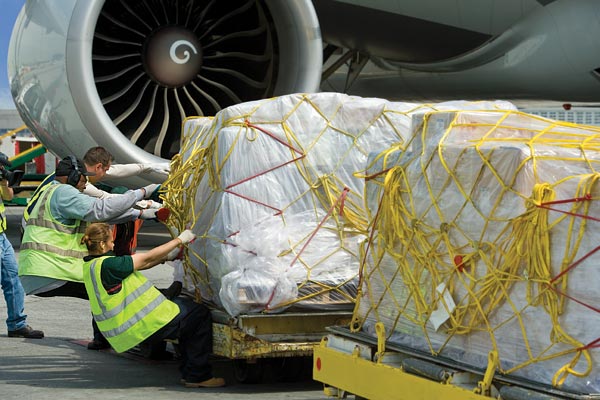
Before an airplane can make another trip, it must remain at the gate to allow passengers to disembark, have cargo and baggage unloaded, have the airplane serviced, cargo and baggage loaded, and board passengers for the next trip. Averaged over a number of trips, this time at the gate is defined as average turn-time.
A typical hub-and-spoke system requires longer turn-times to allow for synchronization between the feeder network and trunk routes. This enables carriers to achieve higher load factors. On the other hand, carriers that typically rely on point-to-point service use a simplified fleet structure, fewer airplane types, and increased airplane utilization. With fewer airplane types, these carriers are better able to substitute airplanes in the event of an unplanned technical problem with an airplane. In order to optimize airplane utilization, point-to-point carriers operate with significantly faster turn-times at the gate. It’s not unusual for a point-to-point carrier to operate with turn-times that are half as long as hub-and-spoke carriers because turn-times influence the number of trips an airplane can make in a given period of time.
Average block time for a given trip distance plus average turn-time constitutes average elapsed time per trip for the airplane. Dividing airplane availability by average elapsed time for a given trip distance provides the maximum number of trips an airplane can complete in any given period. Repeating these calculations for different trip distances using incremental turn-times in minutes provides a maximum number of trips for which an airplane is available, as a function of average trip distance (see solid lines in fig. 1).
AIRPLANE AVAILABILITY AS A FUNCTION OF AVERAGE TRIP DISTANCE
Figure 1
Airplane availability (in terms of number of trips) is quite sensitive to average turn-time for shorter average trip lengths. In this graphic, the solid lines represent the maximum number of annual trips for which an airplane is available as a function of average trip distance using various incremental turn-times. Additional operational factors further limit achievable airplane utilization which is captured in network efficiency factors. The dotted lines represent actual airplane utilization: airplane availability (maximum possible trips) multiplied by network efficiency (which is less than 100 percent by definition).
Operators who would like to take advantage of the cost savings and efficiencies of increased airplane utilization may want to start by educating their workforces about the positive effects of reducing turn-times.
EFFECT OF NETWORK EFFICIENCY ON AIRPLANE AVAILABILITY
Airplane availability — maximum number of trips possible — represents an extreme condition and assumes no other constraints and unlimited traffic demand. In reality, traffic demand is unequally distributed around the clock. Lack of traffic demand and nighttime curfews limit airplane utilization at certain times of the day. Seasonality of demand implies less intense airplane utilization during certain months of the year. Traffic rights, arrival/departure slot restrictions, and other system limitations also restrict actual airplane utilization. All these factors combined create the network efficiency factor. Airplane availability (maximum possible trips) multiplied by the network efficiency factor (being less than 100 percent by definition) gives the actual airplane utilization (see dotted lines in fig. 1).
Flight departures may be distributed around the clock in very different ways, depending on the carrier (see fig. 2). For example, one airline may operate airplanes more intensively between 6 a.m. and 10 p.m. but have almost no utilization between 10 p.m. and 6 a.m. Another airline may distribute departures relatively evenly throughout the 24-hour period, resulting in a better network efficiency factor. This factor varies from operator to operator and by the business model the airline has adopted. Analysis of actual in-service data — such as annual utilization and average flight length — for a number of operators provides an opportunity to calibrate and benchmark the network efficiency factor for different business models.
NETWORK EFFICIENCY IMPACTS AIRPLANE UTILIZATION
Figure 2
This graphic shows two examples of how different airline operating environments produce different network efficiency factors. In this example, one airline (orange bars) operates airplanes more intensively between 6 a.m. and 10 p.m. but has almost no utilization between 10 p.m. and 6 a.m. Another airline (turquoise bars) distributes departures relatively evenly throughout the 24-hour period, resulting in greater network efficiency.
In figure 1, the actual utilization levels as a function of average trip distance and turn-time are based on a 60 percent network efficiency factor, typical for most point-to-point carriers.